Market Sizing Guide

What is Market Sizing?
In this guide, we will focus on evaluating the revenue potential for your product, service or business opportunity, by analyzing the size of your market .
Note: 🍋 Throughout this guide we will use the example of a food supplement company to better illustrate each task and information.
Market sizing is a method used by businesses to estimate the total potential revenue or market share for a product or service in a given market.
Three concepts that are typically used to estimate the market size are the TAM, SAM and SOM:
- TAM stands for Total Addressable Market, which is the total revenue opportunity available in a market.
- SAM stands for Serviceable Addressable Market, which is the portion of the market that a company can realistically target with its products or services.
- SOM stands for Serviceable Obtainable Market, which is the portion of the SAM that a company can realistically capture with its products or services.
There are a few different ways to approach market sizing top down and estimate the potential revenue for a new product, depending on the information that is available.
The industry size as a starting point:
One way is to look at the revenue generated by other businesses in your sector or industry and use that as a starting point for your estimates. 🍋For example, if you are trying to estimate the potential revenue for a new food supplement, you can take the total revenues of food supplements in a country market as a basis and start from there.
The potential customer base as a starting point:
Another way to estimate the potential revenue is by using data on the size of the potential customer base, to determine the total number of people who might be interested in buying the product, and use this as a basis for your estimation. 🍋For example, if we are trying to estimate the potential revenues for a food supplement brand, we would take the total number of people who fall into our main target segment (e.g. men and women between 35 and 65) in a country market and start from there.
Whatever method you choose really depends on what type of information you have at hand and is easier for you to acquire. Since you probably already collected some data on your potential customer base during the customer deep dive yesterday, you might go with the second option.
However, let’s have a look at how to estimate your market size step by step.
What is Market Sizing Good For?
Market sizing is a vital exercise as it provides a clear understanding of the revenue potential and market share for your offerings and serves as a make-or-break factor in making informed “go or no-go” decisions for your business model. By accurately estimating the market size, you can make informed decisions, set realistic goals, and tailor your strategies to achieve a sustainable and profitable venture. Properly estimating your market size will help you to gain:
- Decision Clarity: Quantifying market potential empowers you to make informed “go or no-go” decisions, ensuring alignment with a viable and lucrative market for long-term success.
- Investor Appeal: Market sizing enhances investment attractiveness, enabling you to present well-informed cases to potential investors, boosting the startup’s appeal significantly.
- Operational Alignment: Assessing operational viability becomes seamless with market sizing, aligning proposed operations with the size and characteristics of the target market for sustainable product/service delivery.
- Resource Optimization: Knowing the market size aids efficient resource allocation, preventing wastage by directing efforts toward areas promising the highest return on investment.
- Risk Mitigation: Market sizing helps identify and mitigate potential business risks, allowing proactive implementation of strategies against competitive threats, changing market trends, or unforeseen challenges.
- Market Sizing Insights from market sizing inform strategic pivots, guiding adjustments in target audience, product features, or exploration of alternative market segments for increased chances of long-term success.
Curated Lists 📋
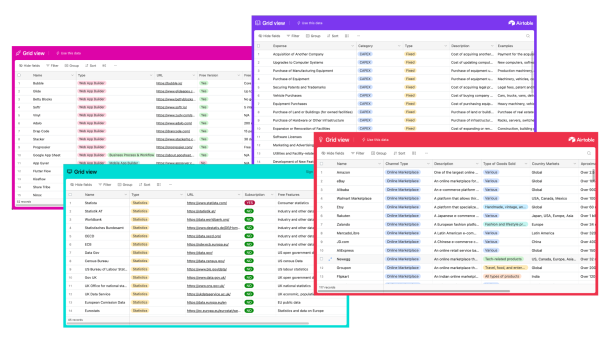
💡 To save you some time, we have prepared a free list of Statistics & Data Resources with which you can use for your Market Sizing.
How to Calculate Your Market Size Step-by-Step:
Step A: Market Sizing Template
Step B: Identify the Market
Step C: Case Structure & Variables
Step D: Data Collection
Step E: Market Size Calculation
Step F: Growth Projections
Step A
Market Sizing Template
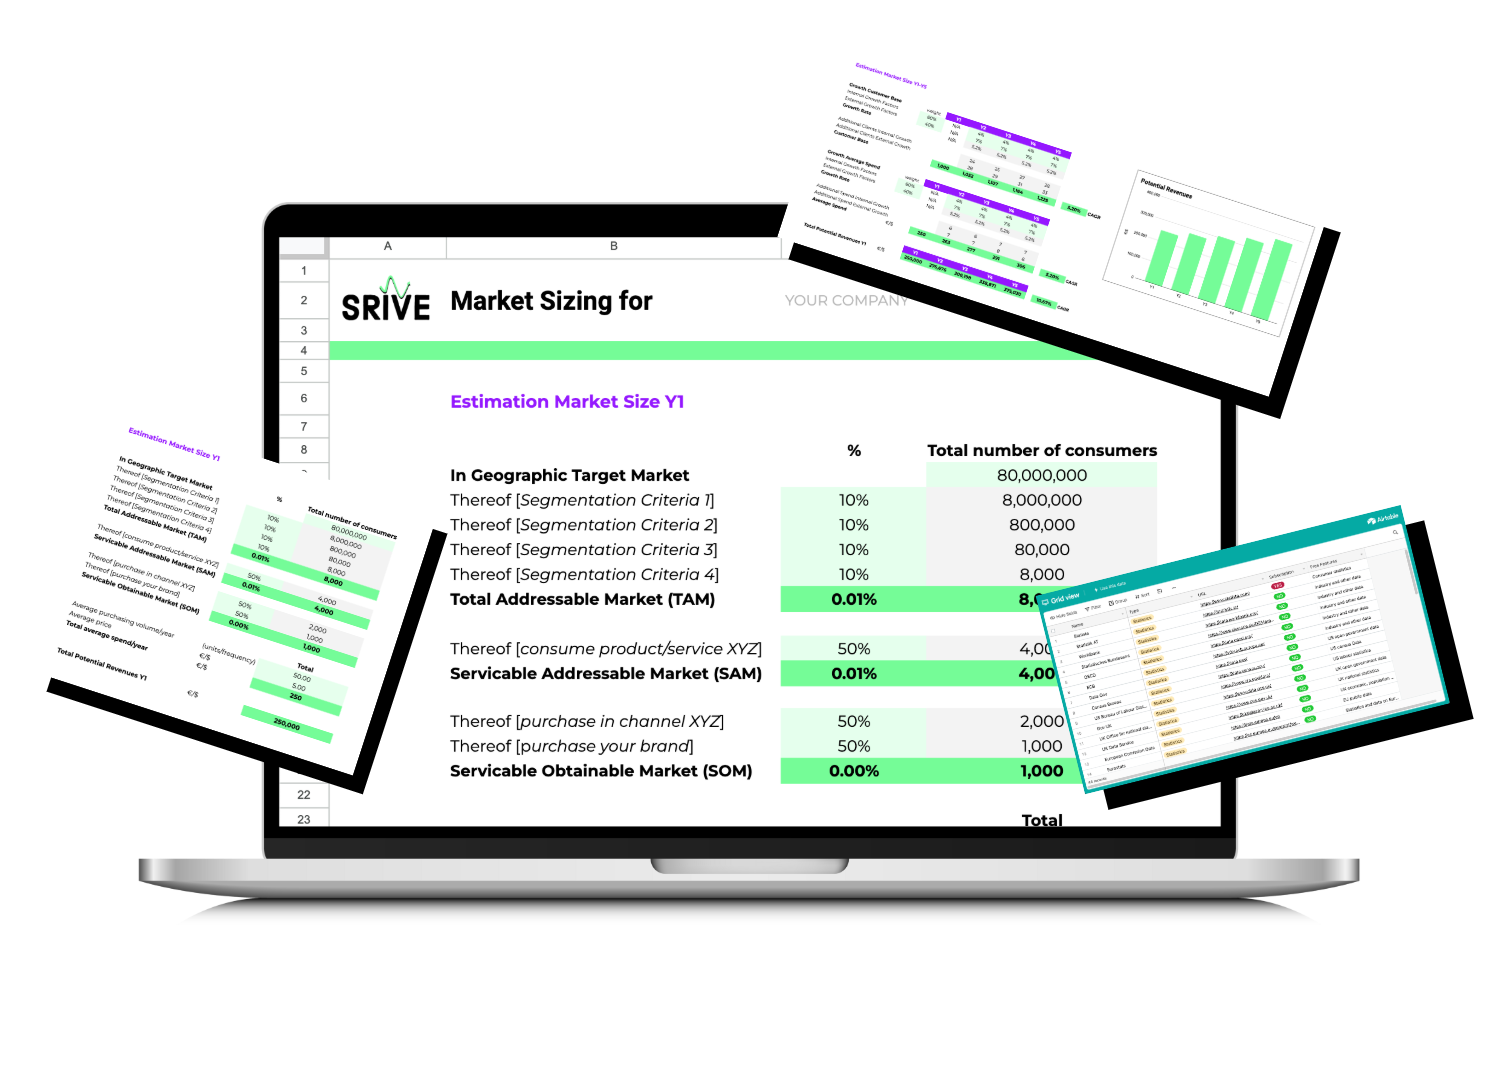
To work on your market sizing you can either build your own Spreadsheet template for example on Google Sheets or you can use our ready-to-use template along with this guide.
Included Templates:
Market Sizing Spreadsheet Model
Step B
Identify the Market

Firstly, you need to make sure you are clear about who it is that you are targeting, since this information will also be needed later to estimate the size of your market.
Therefore, the first step is to clearly define the market you want to study. This might include identifying the geographic location as well as the target customer group you want to offer your product or service to.
You’ve probably already defined your target customer segments during any previous market or customer research. In case you haven’t done that yet, here is a short summary on how to define your target market:
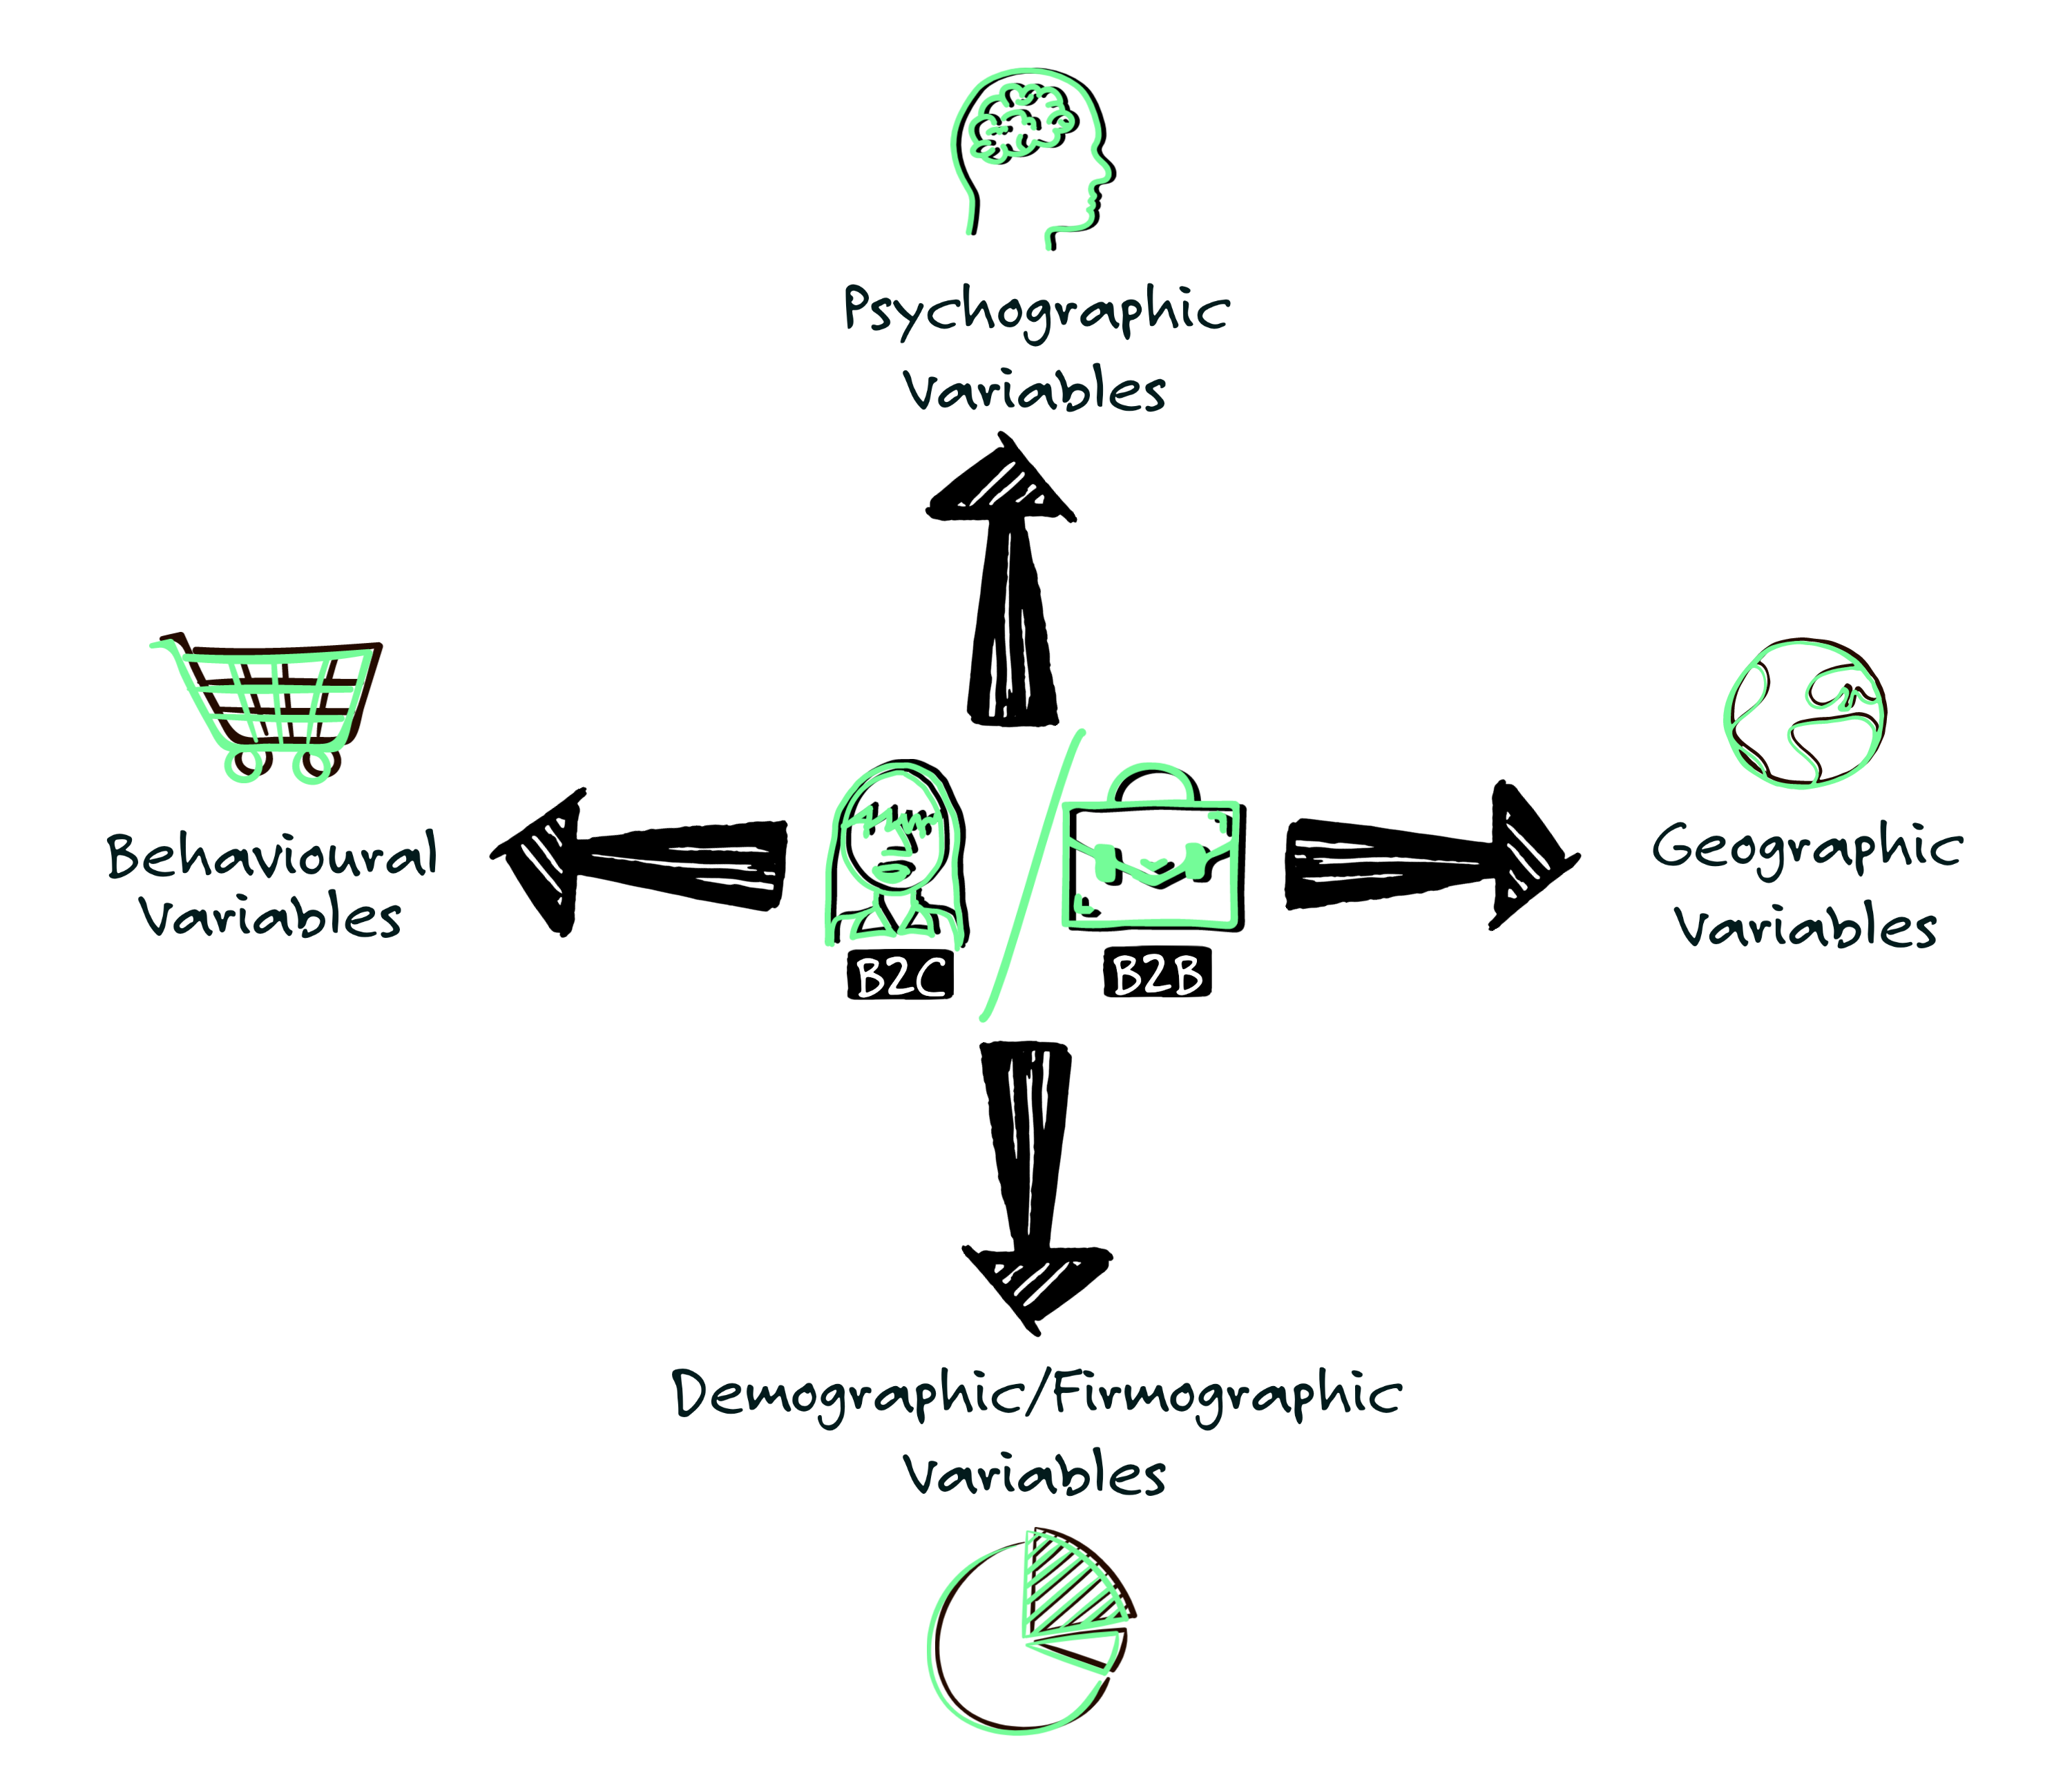
To identify target customer segments, start by distinguishing between B2B and B2C markets. Determine if you’re serving businesses or individual consumers or both.
Then, utilize segmentation variables tailored to each market to narrow down who you are targeting with your products and services.
For B2C customers, describe your customer segments using geographic aspects (region, country, urban/rural), demographic factors (age, gender, income), behavioral traits (shopping habits, decision-making patterns), and psychographic characteristics (lifestyle, interests, values).
For B2B customers, use similar geographic segmentation along with firmographic elements (company size, revenue, industry), behavioral indicators (buying channels, frequency, decision-makers), and psychographic factors (working style, company culture, values).
Step C
Case Structure & Variables

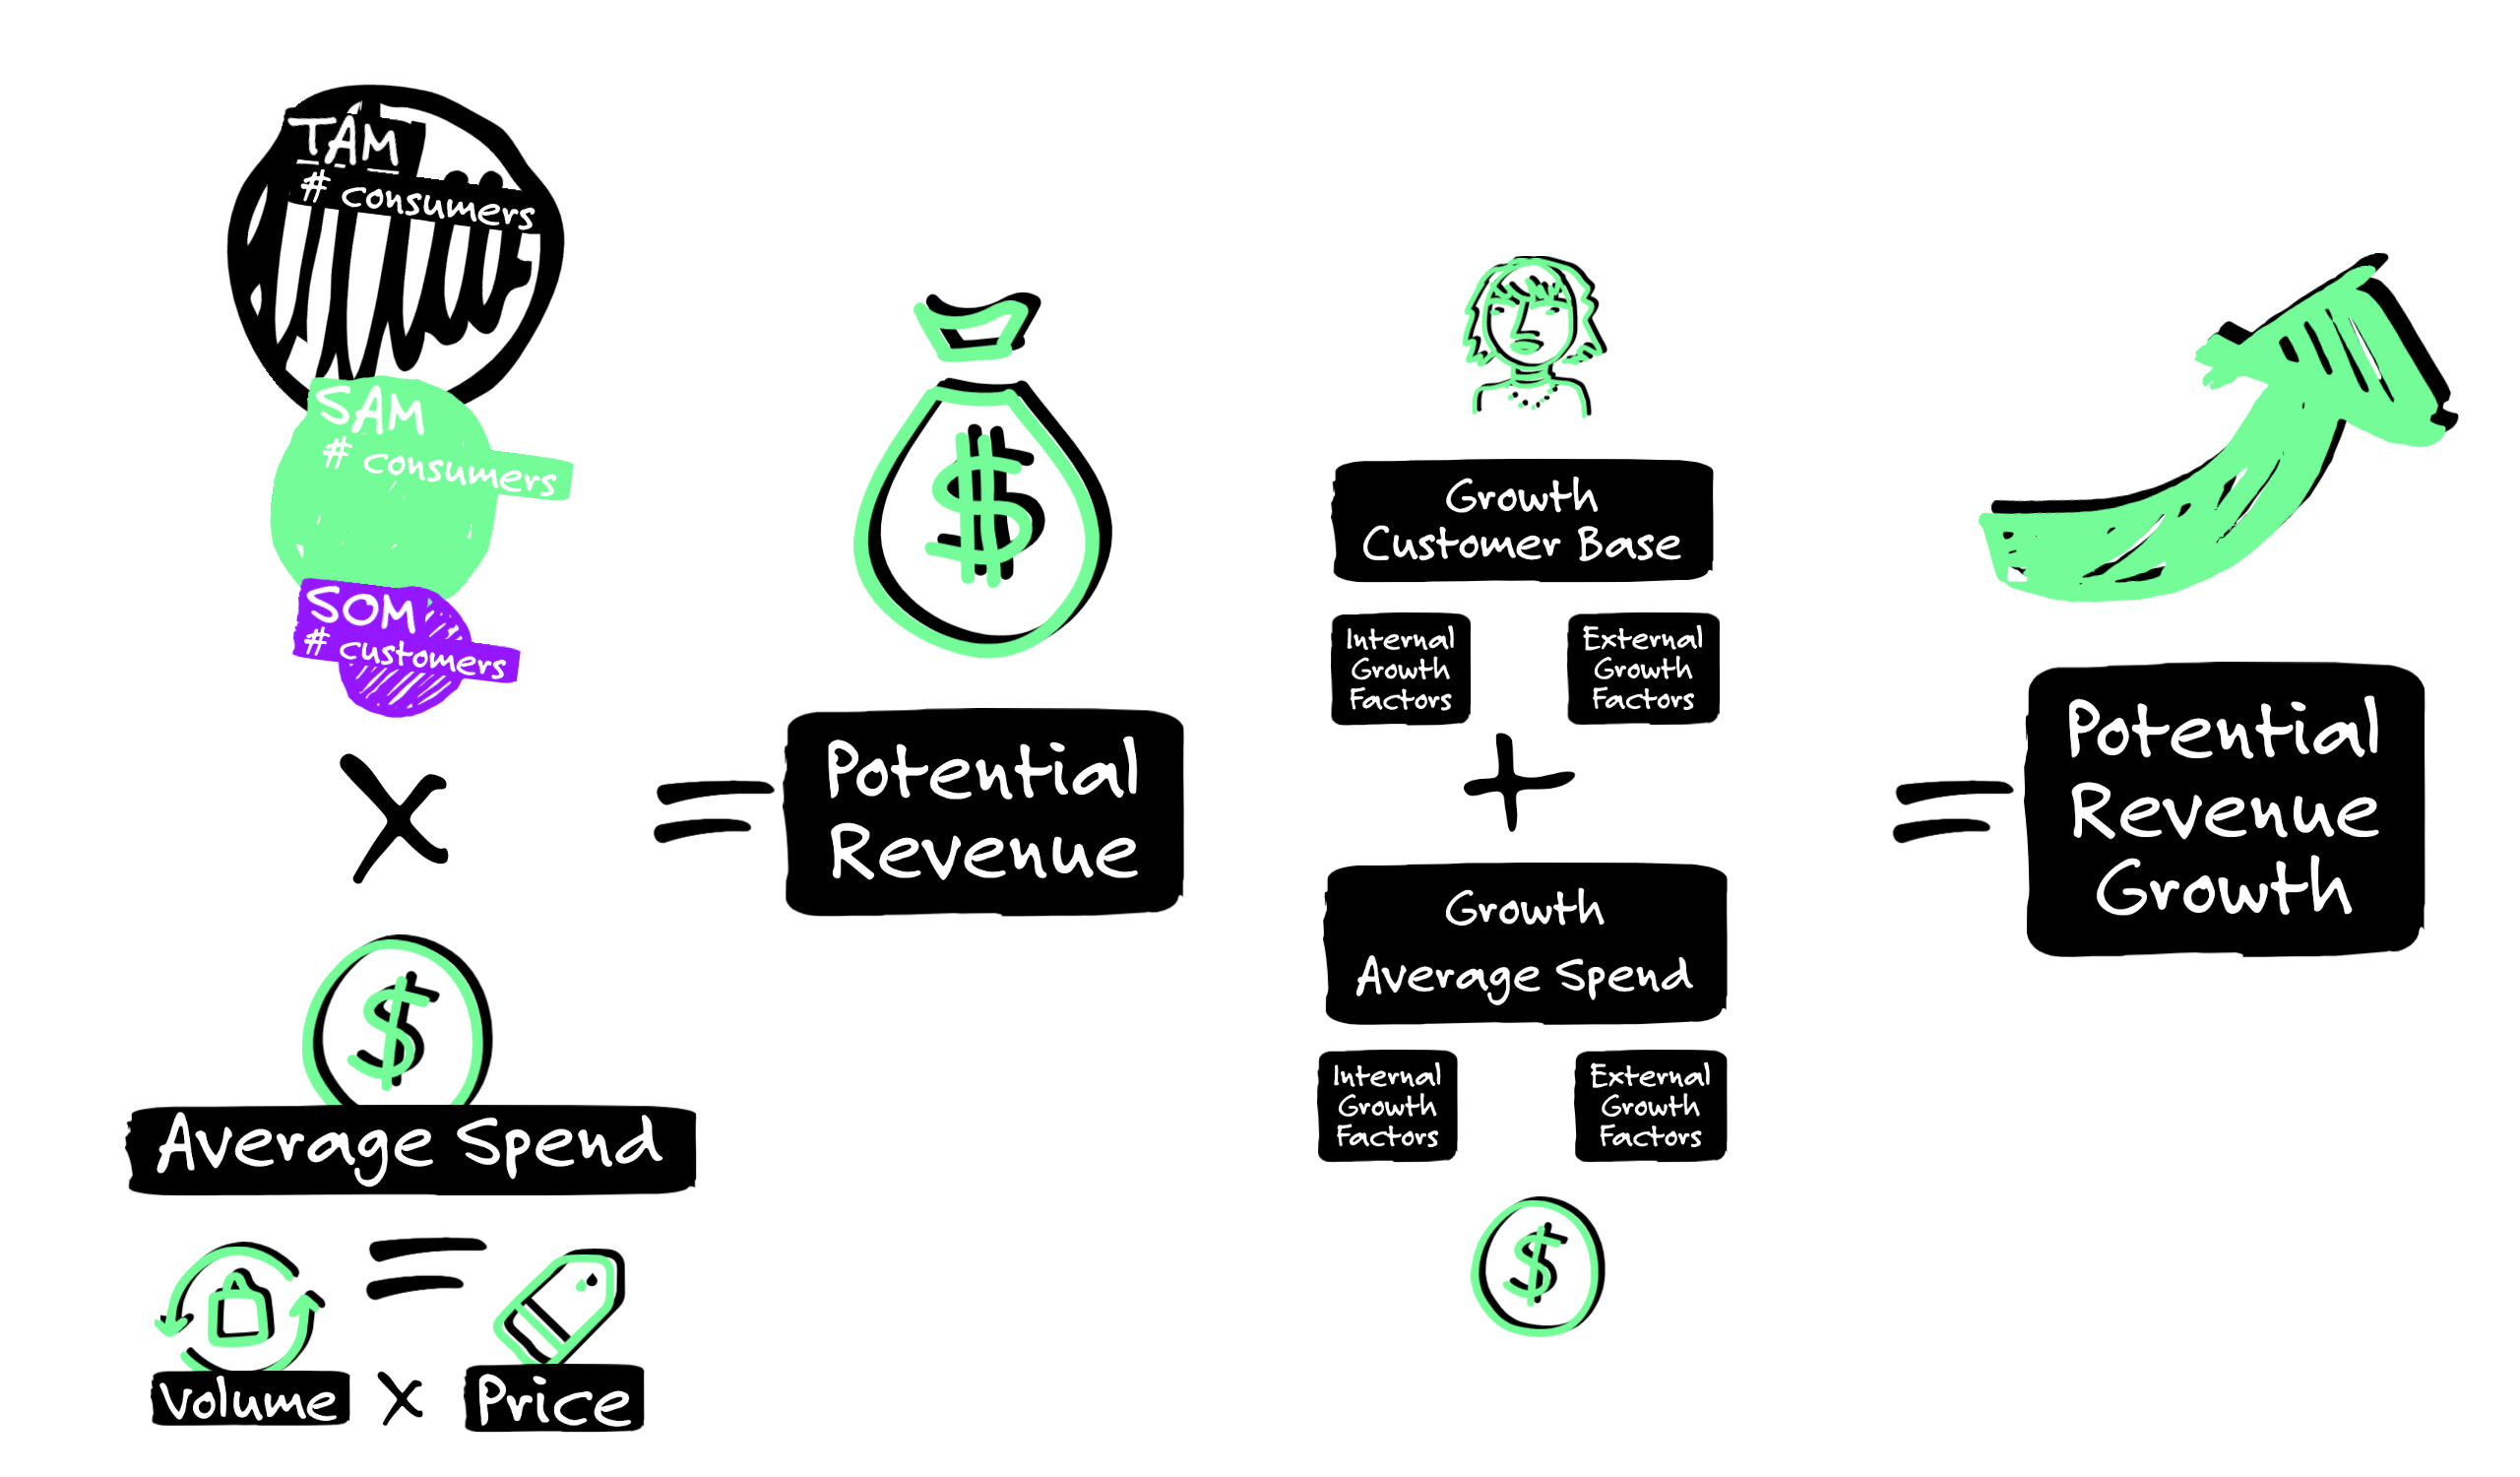
Before starting to collect further data and making your calculations, you should be clear about how you want to structure your case and which variables it includes that can affect the size of the market, in order to search for the right data.
Let’s go back to the very basics. So, the formula to calculate your potential revenues could look for example as follows:
number of customers x average spend per year (average number of units per year x average price) = potential revenues per year
Therefore, first of all you want to find out the number of potential customers. If you offer B2C products/services these will be of course individual people or households, if you are selling B2B products/services those would be businesses.
Number of potential customers
To break down the number of potential customers we will use the TAM, SAM and SOM.
TAM: Number of consumers that fall into your target segment can be defined by…
The number of people/businesses in your geographic market, meaning:
- The number of people/businesses in a certain country
- The number of people/businesses in a certain region or city in case your sales area is limited to those
And out of those the number or % of people who fulfill your demographic/firmographic segmentation criteria e.g.
For B2C consumers, this could be:
- Number or % of people who are a certain gender
- Number or % of people who fall into a certain age group
- Number or % of people with a certain income level
- Number or % of people with a certain profession
- Number or % of people with a certain family status
- Number or % of people with a certain number of children
- Number or % of people with a certain household size
- Number or % of people with a pet
- etc.
For B2B consumers, this could be:
- Number or % of businesses that have a certain company size
- Number or % of businesses that gain certain company revenues
- Number or % of businesses that belong to a certain industry/sector
- Number or % of businesses that have a certain company age
- etc.
Think about all the criteria you defined for your target segment that could help you to narrow down your market.
SAM: Number or % of consumers that are interested in the type of product/service you sell
This one is a little trickier and not as straightforward as geographic and demo/firmographic variables. Sometimes you might be lucky and find direct consumption data on a certain product or service from public consumer research e.g. 🍋 “X% of people who say they consume food supplements.”
But in most cases you will have to derive this data in an indirect way.
Think for example about the reasons why certain people would consume a product/service. Some example could be:
- People with acne consume acne cream → Find out: What % of people suffers from acne
- People who are environmentally conscious buy from a second hand shop → Find out: What % of people say they live an environmentally conscious lifestyle?
- Startups that receive funding heavily invest in marketing services → Find out: How many startups receive funding every year?
You get the point, right? You will need to try to find ways to derive the number of people/businesses that potentially would buy a product/service like yours.
SOM: Number of consumers that choose your brand instead of those of competitors
To estimate the number of people who would choose your brand, you can look at variables such as the marketing and purchase channels.
For example, if you purely sell online via your own online shop, try to find indicators of what % or number of people/businesses use this purchasing channel.
However, to further break it down, you will most likely have to make your own assumptions. To get an approximation, you could research similar businesses like yours and try to figure out how much market share they captured in their first year of business.
Take into consideration that the market share you are able to grab is very closely related to how much you can spend on marketing activities to get the awareness of potential customers. So if your business is new, and not funded by external investors you probably will have a very limited budget to spend, therefore be realistic and use a rather pessimistic approach to estimate your share.
Average spend per year:
Once you have the number of your potential customers, you want to figure out how much they would spend on average per year on your product/service.
There are different types of variables you can use to estimate an average spend per year, again this depends on which information you have available.
- Average spend per year: You probably find data that directly states how much people on average spend per year on a certain product/service
- Average purchasing volume per year: Or you can use data on the average number of units/frequency a person purchases of a product/service in a year.
- Average price: The average price you could charge for your product/service (based on competitor data)
Take then the average number and multiply it by the average price to get the average spend per year.
It is of course possible that you will find this data but for a different time span. So for example, instead of the average spend in a year, you find data on the average spend in a month or a week. In this case, of course you’ll need to bring it to the time frame of a year. You then also want to take into account seasonalities, meaning the average spend or volume can differ depending on the season or month of the year. 🍋 For example, the consumption and therefore spend on the food supplement Vitamin D will be higher during winter in countries in the northern hemisphere due to the lack of sunlight.
With these variables, you should be able to calculate your potential revenues per year.
Step D
Data Collection

Once you have defined the structure and variables for your market sizing case, you will need to gather data on those variables.
In some cases, you may not have enough data to make a precise estimate of the market size. In these cases, you will need to make assumptions and estimates based on the available data and your knowledge of the market.
- You probably already gathered some relevant information during your customer deep dive, so go back to your whiteboard and check the information you have.
- Then you can of course, as any good consultant would, just google for the specific information you need.
💡 Also, there is a variety of public information available on population, industry and even consumer data, you will find a selection of resource on the List above.
Step E
Market Size Calculation

Once you have collected the data you need, you can start to analyze it and to calculate the potential size of the market.
Use your market sizing spreadsheet and go step by step:
- Calculate the TAM
- Calculate the SAM
- Calculate the SOM (potential customer base)
- Calculate the average spend
- Multiply the average spend with the potential customer base
Now you should have an estimation of your potential revenues in year 1.

Step F
Growth Projections

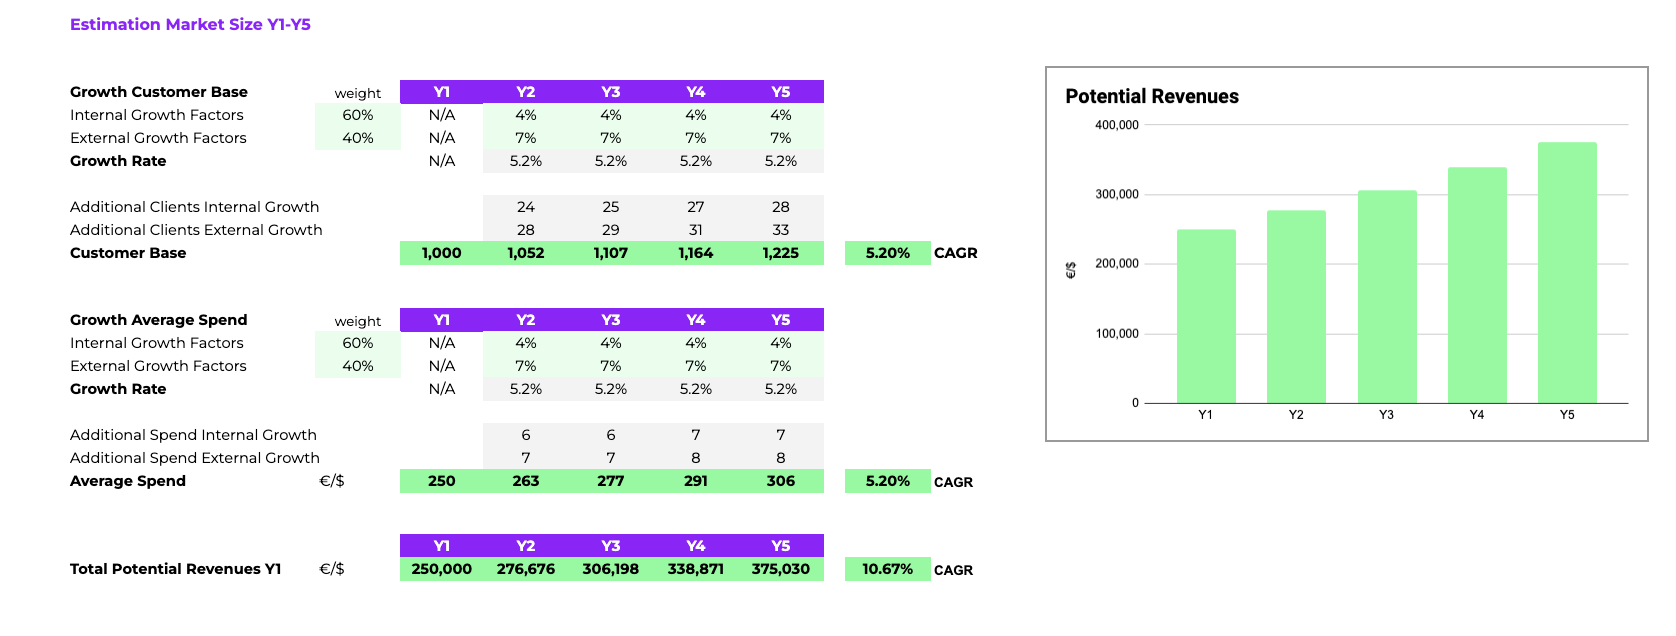
However, you not only want to know how much you could be able to earn in the first year but also over time, for example within the next 3 or 5 years. You want to figure out the growth potential for your product/service revenues by applying a growth rate.
You can apply a growth rate to both:
- Your customer base: meaning your loyal customer base grows over time. Of course you will also have customer churn, but you will hopefully acquire more new customers than those that will leave, so your total customer base grows.
- The average spend: meaning the average spend of the individual customers can also grow over time because they become more loyal to your brand.
Also, your growth potential for each can depend on external as well as internal factors.
External factors – meaning the growth of the general demand in this industry.
For external growth, you can estimate a Compound Annual Growth Rate (CAGR) for any market evolution data you collected. The CARGR is the measure of the average growth over a specified period of time, typically measured in years. It is calculated by taking the nth root of the total percentage growth of a value, where n is the number of years in the period. The formula looks as follows:
CAGR = (Ending value / Beginning value) ^ (1 / n) – 1
For example, if you got a beginning value of $100 and an ending value of $120 after 3 years, the CAGR would be calculated as follows:
CAGR = ($120 / $100) ^ (1 / 3) – 1 = 1.086 – 1 = 0.086 = 8.6%
So you could for example try to find data on how your industry’s revenues have evolved over the last years, calculate the CAGR and project this on your potential revenues by applying the same % growth rate.
Internal Growth – On the other hand, you can have internal growth factors for example through increasing your marketing budget. The more marketing money you spend the more people will become aware of your product/service, the more you can convert to customers and increase your market share vs. competitors.
So think about by how much (%) you could be able to increase your marketing budget over the next 5 years and what impact (%) this could have on your revenues. Of course, if your business is new, and you don’t have any past data available that serve as an evidence for the impact of your marketing spend on your sales, you will have to make an assumption again.
Now that you have those two % figures, you will have to calculate the weighted average of both to get a global potential growth rate.
So you will first need to decide on the weight of your external factor and the internal one and with this calculate the weighted average.
For example, let’s say your external factor is EX and your internal factor is IN, with weights of 40% and 60%, respectively. For EX, you estimate 4% growth, and for IN you estimate 7% growth . The weighted average of these two factors would be calculated as follows:
(40% * 4%) + (60% * 7%) = 1,6% + 4,2% = 5,8% Growth Rate
